

2015 Greenhouse Gas Emissions Inventory

Executive Summary
The City of Dallas (City) recognizes that the quality of life for our citizens is directly tied to the quality of the environment we live in. The City is committed to addressing its contribution to global climate change and creating a more sustainable community. As part of this effort, the City of Dallas Office of Environmental Quality & Sustainability (OEQS) engaged Modern Geosciences, LLC (Modern) to conduct a comprehensive Greenhouse Gas Emission Inventory for calendar year 2015.
The project developed an extensive inventory of sources of greenhouse gas (GHG) emissions resulting from the internal agency activities and the community. This specifically included sources that were not modeled in previous inventories; thus 2015 estimates would now serve as a true baseline going forward to inform City priorities and help gauge success in reducing GHG emission and contribution to climate change.
Inventory Protocols and Reporting Frame Work
Several greenhouse gas protocols were consulted for this inventory development. The most recent internationally accepted protocol, C40 Cities Climate Leadership Group (C40), the World Bank, ICLEI-Local Governments for Sustainability (ICLEI), and World Resources Institute (WRI)’s Global Protocol for Community Scale Greenhouse Gas Emissions (GPC) was the principle guidance for this inventory. The protocol allows for two levels of reporting: BASIC (a level that covers emission sources that occur in almost all cities, covering emissions from stationary energy consumption, transportation, and waste generated within the city boundary) and BASIC+ (level covers BASIC sources plus emissions from industrial process and product use, forestry and land use, trans boundary transportation and energy transmission and distribution losses). This inventory encompasses BASIC+ level sources where reliable and complete data was available.
Municipal emissions, a subset of the community, were modeled in accordance with ICLEI – Local Governments for Sustainability USA Local Government Operations Protocol (LGOP). ICLIE’s Clear Path Platform (ClearPath) was utilized in this inventory development for reporting and record keeping purposes.
2015 GHG Emissions
City communities are not isolated; activities taking place within a city boundary generates emissions outside the city boundaries. To distinguish between them, emissions are grouped in three categories depending on where they occur.
-
Scope 1: GHG emissions from sources located within the City boundary
-
Scope 2: Emissions occurring as a consequence of energy consumption from the grid
-
Scope 3: City-induced emission occurring outside the City boundary.
Emissions Offsets
Various initiatives are taken by the City and the community to reduce emissions and improve air quality. Emissions that were avoided by these initiatives are not included in the net GHG emission inventory, but reported as information only.
Other Avoided Emissions: 467,777 mT CO2e (Emissions that could have occurred if measures were not taken; measures like recycling and transit service options).
-
2015 recycling waste reduced: 155,141 mT CO2e
-
Transit services reduced: 352,636 mT CO2e
These Community Scale factors are not accounted for in the net Greenhouse Gas Emissions Inventory, but worth noting for the general benefit they bring to the community.
The Mayor’s Commitments
The City of Dallas has entered into several national agreements to reduce GHG emissions. In 2006, the Mayor of Dallas signed the U.S. Mayors Climate Protection Agreement, a commitment by mayors to reduce greenhouse gas emissions in their own cities and communities to seven percent (7%) below 1990 levels by 2012. The City has met this goal. Currently, the City is working toward fulfilling its commitment of reducing emissions from City operations to 39 percent (39%) under 1990 levels by 2017.
The United Nations Framework Convention on Climate Change (UNFCCC) has called for limiting temperature increases this century to 2 degrees Celsius, or a 50 percent reduction in global GHG emissions and an 80 percent greenhouse gas (GHG) reduction in developed countries by 2050. In December 2015, 196 countries negotiated the Paris Agreement at the United Nations Climate Change Conference, COP 21, agreeing to reduce GHG emissions to levels necessary to limit global temperature increase to less than 2 degrees Celsius[1]. In July 2017, Mayor Mike Rawlings signed the Climate Mayor’s agreement and vowed to “adopt, honor, and uphold the commitments to the goals enshrined in the Paris Agreement.” As part of the commitment, Climate Mayors pledged “We will intensify efforts to meet each of our cities’ current climate goals, push for new action to meet the 1.5 degrees Celsius target, and work together to create a 21st century clean energy economy…”[2]
Based on the current inventory, it appears the City
Government’s emissions have seen significant
decreases since this original commitment was
made. When compared to previous emission
inventories, the City has reduced its impact by
over forty percent (40%) from 1990 levels in
2015. The community as a whole has reduced
emissions by twenty percent (20%) from 2005 in
2015. Since remodeling historic bench mark
year inventories were beyond the scope of this
project, further modeling with consistent
methodology is recommended within the following
inventories to confirm this goal has been met and
possibly even exceeded. The current emission
reduction trends suggest Dallas is well on its way to
meeting this goal for their contribution to GHG.
Key Points:
-
Most comprehensive inventory, including sources from BASIC+.
-
City Government well on its way meeting the target of reducing GHG emissions by 39% below the 1990 level by 2017.
This is an executive summary of the City of Dallas' Greenhouse Gas Emission Inventory for the calendar year 2015. For the full report or to ask questions, please contact kevin.overton@dallascityhall.com.
[1]United Nations Environmental Program, Climate Action. Sustainability Innovation forum 2015. http://www.cop21paris.org/about/cop21
[2] Climate Mayors. June 1, 2017. https://medium.com/@ClimateMayors/climate-mayors-commit-to-adopt-honor-and-uphold-paris-climate-agreement-goals-ba566e260097


2
What does that mean?
The emissions of the city government are a small part-- only 2%-- of the community as a whole. Without looking at the community emissions, we would not have a clear picture of the city's real impact on the climate. That is why community action is of paramount importance as we embark on Dallas' Comprehensive Environmental and Climate Action Plan.
2015 municipal emissions compared to the average emissions of 5 similar cities
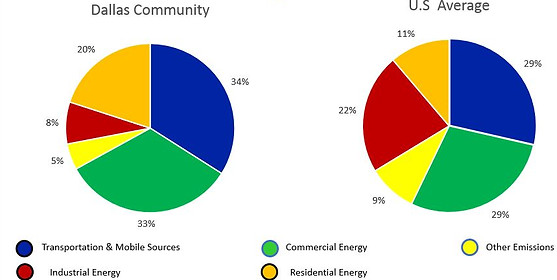
2015 community emissions compared to U.S/ average